We all depend on the resources and ecosystem services provided by Mother Earth. Therefore, Chr. Hansen aspires to drive a positive environmental change through the positive impact of our products and through our commitments to addressing our planetary impact. Read about our environmental performance below.
Supporting sustainable agriculture
Abrir
Cerrar
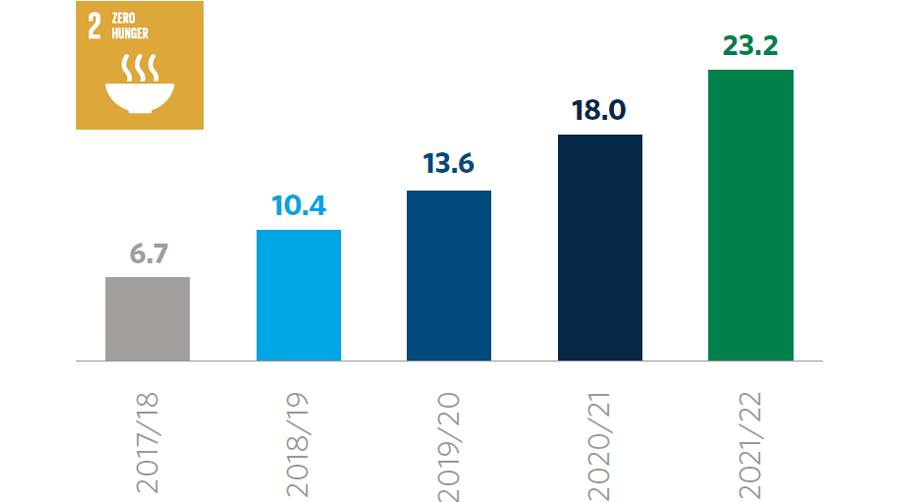
Regenerative agricultural practices are needed to deliver a sustainable transformation of the agricultural sector. In 2021/22, Chr. Hansen increased the area of agricultural land covered with biological plant protection to 5.2 million hectares due to increased sales and market expansion of Plant Health products. With Chr. Hansen’s plant protection solutions, farmers are able to reduce the use of chemical pesticides while maintaining high crop yields and crop resilience. To date, the biological plant protection solutions Chr. Hansen has delivered cover an accumulated area of 23.2 million hectares. Chr. Hansen is well on track to reach its target of 25 million hectares covered by 2024/25.
Farmland treated with natural solutions in m ha
Reducing food waste
Abrir
Cerrar
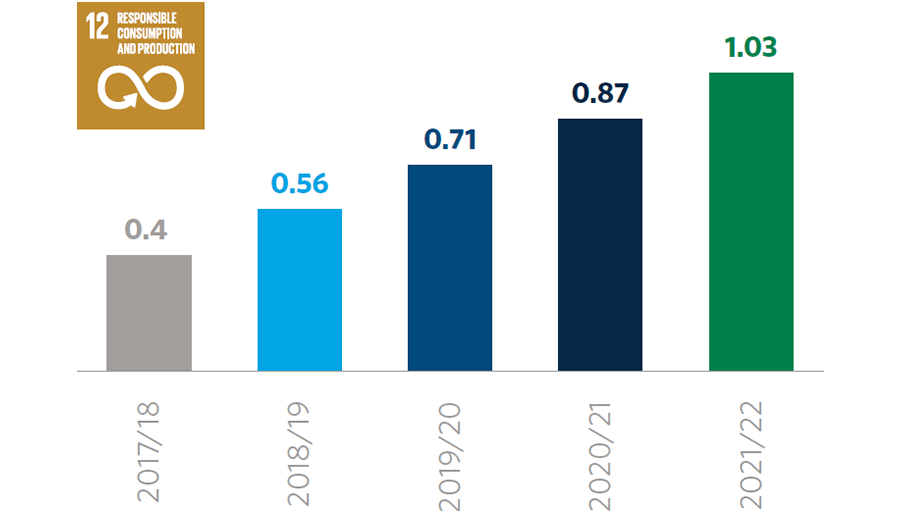
Food waste is a global challenge and striving to reduce it holds great potential for increasing productivity and reducing the environmental impact of the global food system. This year, Chr. Hansen’s fermentation solutions with bioprotective properties helped avoid 160,000 tons of yoghurt waste. This is the same number as reported last year as bioprotective solutions showed modest growth. Chr. Hansen’s target is to reduce global yogurt waste by 2 million tons by 2024/25, and since the base year 2015/16, Chr. Hansen’s bioprotective cultures have helped save an accumulated 1,030,000 tons of yogurt from being wasted.
Yogurt waste saved in m tons
Revenue contribution to the un Sustainable Development Goals
Abrir
Cerrar
Overall in 2021/22, 80% of the revenue from Chr. Hansen’s microbial products enabled a positive sustainable impact in the food, health, and agricultural industries. This sustainable impact contributes to three of the United Nation’s Sustainable Development Goals (SDG): 'Zero Hunger', 'Good Health and Well-being' as well as 'Responsible Consumption and Production'. This year, sales of HMOs and probiotics from recent acquisitions were integrated in the number. The new HMOs and probiotics deliver positive health effects but the mapping against the SDGs is still ongoing causing a slight decline from 82% in 2020/21. Chr. Hansen does not sell products with harmful impacts, but the percentage only includes revenue from products with documented positive effects when applied. Negative effects such as the environmental footprint of production are not accounted for in this percentage. Chr. Hansen’s target for 2025 is to sustain an SDG revenue contribution of 80% or higher.
| |
2021/22 |
2020/21 |
2019/20 |
|
Revenue contribution to the UN SDGs
Gross revenue contribution, %
|
80 |
82
|
81 |
|
Better farming
Farmland treated with natural solutions, ha.
Accumulated ha. (base year 2015/16)
|
5.2m
23.2m |
4.4m
18m
|
3.2m
13.6m
|
|
Food waste2
Yogurt waste reduction, tons3
Accumulated tons (base year 2015/16)
|
160,000
1,030,000 |
160,000
870,000 |
160,000
710,000 |
2 With Chr. Hansen’s Science Based Targets, the method for scope.
3 Upstream transportation was updated. The update entails a general improvement in data quality and the use of DEFRA emission factors including radiative forcing for air transport. Historical data for 2019/20 and 2020/21 is updated consequently.
Committing to Science Based Targets
Abrir
Cerrar
Through the ‘Think Climate. Naturally.’ program, Chr. Hansen is committed to climate action in order to future-proof the business for a low-carbon economy. This financial year, Chr. Hansen’s climate targets were approved by the Science Based Targets initiative validating that the targets are in line with the climate ambition of the Paris Agreement5. With 2019/20 as the base year, Chr. Hansen has set ambitious, yet realistic, absolute reduction targets:
- Scopes 1+2 target: 42% reduction of carbon emissions from own operations by 2030.
- Scope 3 target: 20% reduction of carbon emissions from our supply chain by 2030.
As part of the ‘Think Climate. Naturally.’ program, a living decarbonization roadmap is developed providing the Company with initial visibility on how to reach the climate targets. The roadmap includes initiatives like conversion to renewable electricity, resource efficiency projects and a supplier engagement program.
5 UNFCCC, 2015.
Company carbon footprint (scopes 1, 2 and 3)
Abrir
Cerrar
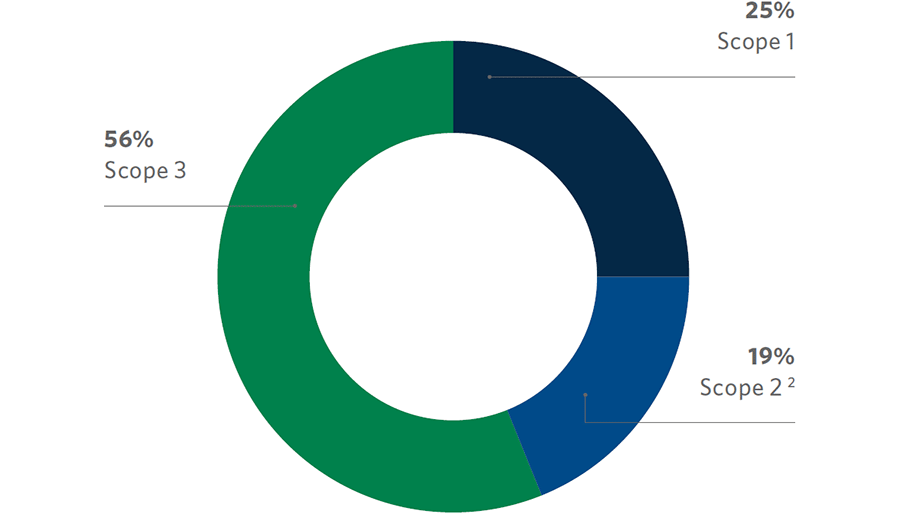
In 2021/22, Chr. Hansen’s scopes 1+2 emissions increased from last year to around 42,100 tons CO2e. Despite the increase, we still maintain an 11% reduction from the Science Based Targets base year 2019/20. This reduction is realized through an increased share of renewable electricity. Chr. Hansen applies the market-based approach as per the Greenhouse Gas Protocol to account for scope 2. In 2021/22, Chr. Hansen for the first time has estimated its full scope 3 impact including all emissions across the entire value chain in accordance with the Greenhouse Gas Protocol.
The scope 3 screening was conducted as part of the Science Based Targets process. The Company is in the process of implementing a professional monitoring system and setting up a supplier engagement program allowing Chr. Hansen to report scope 3 on a yearly basis going forward. Historically, Chr. Hansen has accounted for upstream transportation as per the Greenhouse Gas Protocol. For this scope 3 category, the global supply chain challenges due to the pandemic and geopolitical instability have resulted in an increase of around 4,000 tons CO2e since last year to a total of 54,600 tons CO2e. That said, emissions are still lower than emissions in 2019/20, the base year of Chr. Hansen’s Science Based Targets.
Total annual carbon emissions in CO2 ton equivalents
Renewable electricity and global energy consumption
Abrir
Cerrar
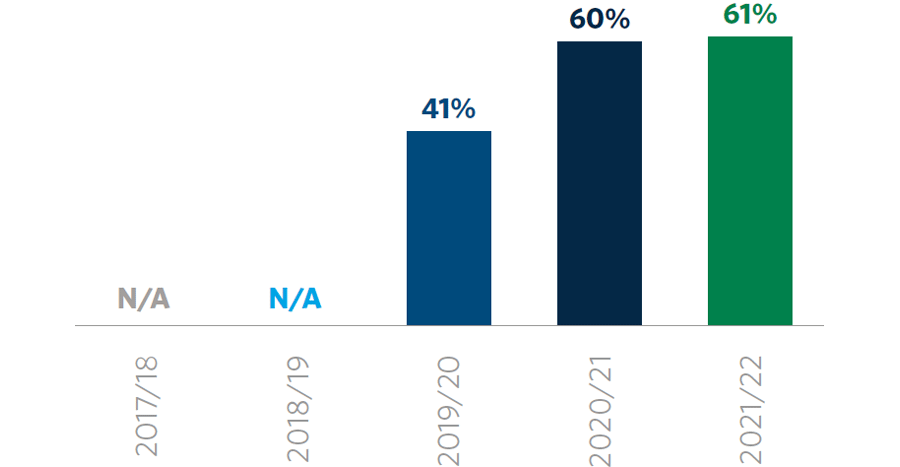
At the end of 2021/22, Chr. Hansen’s share of renewable electricity globally increased to a total of 61% from 60% in the previous financial year. The integration of acquisitions not sourcing renewable electricity challenge this target, however, an increase was secured at two of our production sites, Pohlheim and Valinhos, which have begun sourcing renewable electricity. As a result, all Chr. Hansen sites in Denmark, two in Germany and one in Brazil are now covered by renewable electricity.
The work continues to ensure fulfillment of the 2024/25 Planet target of 100% renewable electricity globally. Chr. Hansen’s overall energy consumption of fuels, heat, steam and electricity increased by around 43,000MWh to a total of 224,000MWh. The increase reflects the integration of environmental data from the acquisitions of UAS Labs and Jennewein into Chr. Hansen’s EHS system.
Renewable electricity
Waste management
Abrir
Cerrar
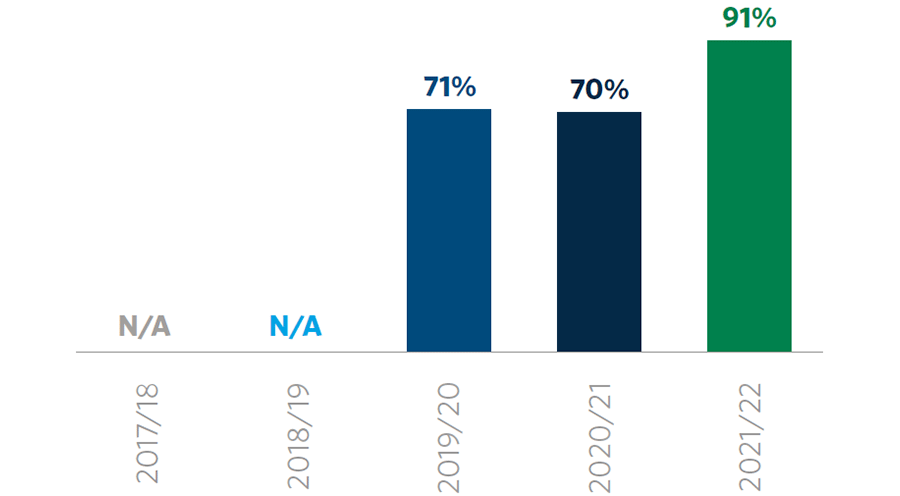
Chr. Hansen’s most material waste stream from operations is biowaste. In 2021/22, 91% of the biowaste produced was managed in a circular manner, as it was used as a resource in other applications, e.g. for biogas production or as a fertilizer. This is an increase from 70% last year and it is achieved through an external partner reusing the nutrients in biowaste for the processing of fertilizer. Chr. Hansen continues to identify relevant partners regionally to fulfill the Planet target of 100% circular management of biowaste by 2024/25. Solid waste accounts for roughly 4,900 tons. This year, the share of recycled solid waste decreased to 54% due to the integration of acquisitions. This year’s share is still an increase compared to 2019/20 and before, and a result of the Company’s focused efforts on environmental management and increased circularity at all sites globally.
Circular management of biomass
Recyclable key packaging
Abrir
Cerrar
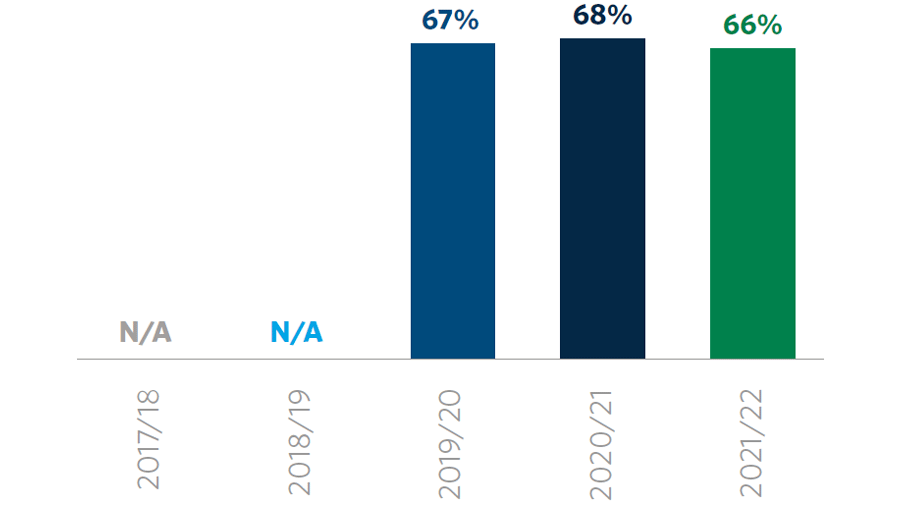
With the ambition of making the key packaging solutions recyclable at the customer end, Chr. Hansen supports a circular economy for packaging materials. For Chr. Hansen, key packaging solutions are categories that constitute 10% or more of the yearly global packaging spend, including close to 70% of Chr. Hansen’s total packaging material within the scope of the target.
In 2021/22, 66% of Chr. Hansen’s packaging solutions were made from recyclable materials. This is a slight decline of 2 percentage points compared to the previous financial year caused by the inclusion of acquisitions and changes in prices of our packaging solutions. Still, Chr. Hansen progressed well by successfully running tests of recyclable single material Renewable electricity1 Circular management of biomass1 Recyclable key packaging1 foils in production. The single material foils can be used nce all technical tests have been passed and will bring Chr. Hansen closer to the target of 100% recyclable key packaging by 2024/25.
Recyclable key packaging
Water
Abrir
Cerrar
Chr. Hansen’s water consumption increased slightly this year to around 1,330,000 m³, as the Company included acquisitions and increased production. Wastewater decreased slightly to 914,000 m³ in 2021/22. The decrease in the wastewater is due to the fact that some of the wastewater is eluate that is now recycled and therefore reported as circular biowaste.
Environmental violation
Abrir
Cerrar
As a result of Chr. Hansen’s continuous work with improving environmental management globally, we managed to drive down the number of environmental violations to 0 in 2021/22.
| |
2021/22 |
2020/21 |
2019/20 |
|
Energy
Renewable energy (electricity), %6
Total energy consumption, MWh6
|
61
224,319
|
60
181,327
|
41
176,539
|
|
Company carbon footprint
Total Scope 1 CO₂e emitted, tons6
Total Scope 2 CO₂e emitted, tons (location-based)6
Total Scope 2 CO₂e emitted, tons (market-based)6
Total Scope 3 upstream transportation CO₂e emitted, tons7
|
24,231
24,305
17,897
54,554 |
16,303
20,246
15,963
50,505
|
17,073
23,224
30,382
56,168
|
|
Water
Total water consumption, m³ 6
|
1,329,712
|
1,233,281
|
1,142,435
|
|
Waste
Recycled biomass, tons6
Circular management of biomass, %6
Recycled solid waste, %6
Solid waste, tons6
Hazardous waste, % of solid waste6
Wastewater, m³ 6
|
145,603
91
54
4,900
2
914,058 |
96,193
70
60
3,764
2
955,601 |
99,737
71
49
3,694
3
865,430 |
|
Packaging
Recyclable key packaging material, %
|
66
|
68
|
67
|
|
Environmental Violations
Environmental violations, no.
|
0
|
2
|
0
|
6 This number is restated as a new data collection system was implemented during this financial year, improving data quality. Also, acquisitions are included with historical data.
7 With Chr. Hansen’s Science Based Targets, the method for scope.