The focus on environmental, social and governance (ESG) matters has for many years been integral to Chr. Hansen. Today, the demand and interest in this area are rapidly increasing driven by investors, customers and regulators. At Chr. Hansen, sustainability and ESG is anchored with executive management, and targets are defined as part of our 2025 strategy.
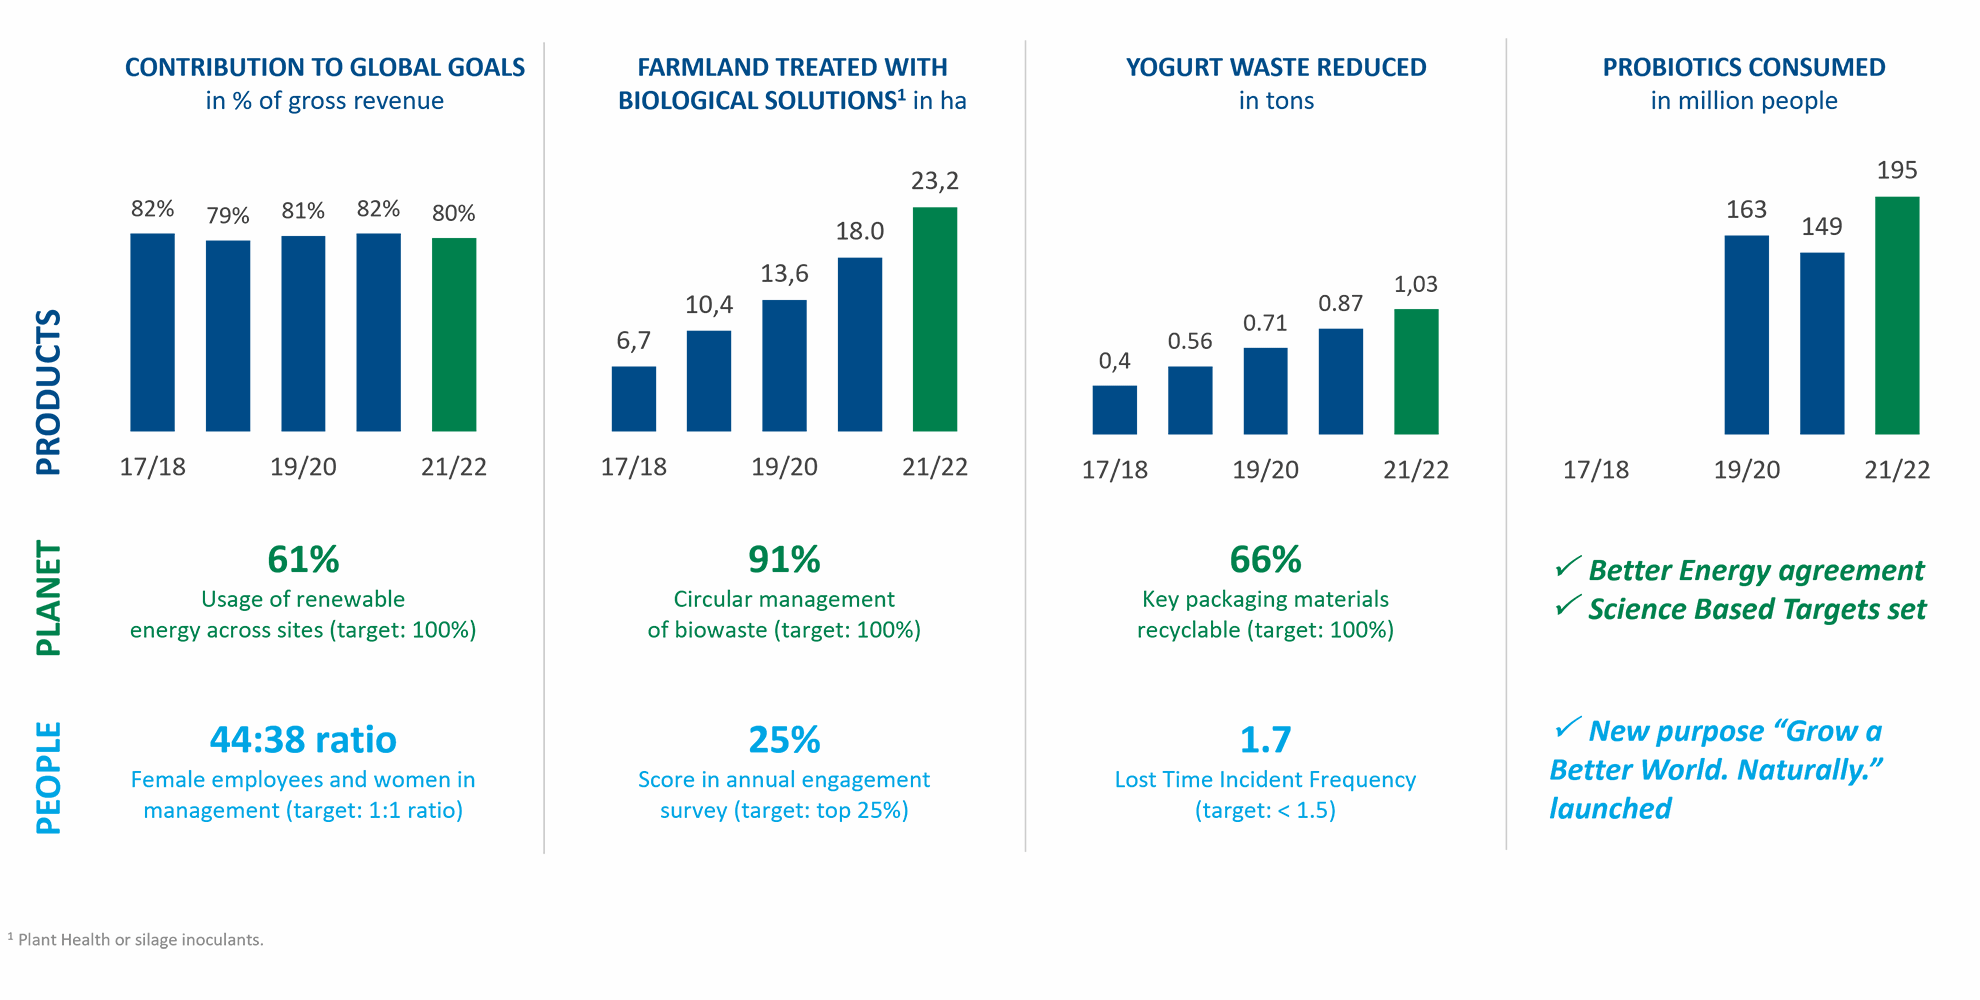
Our sustainability and ESG ambitions evolve around three strategic areas. Our Product targets leverage the positive sustainable impact of our products and innovations. Our Planet targets address the planetary impact of our operations and our supply chain. And our People targets express our commitment to investing in a diverse, engaged and safe workforce. Please see the latest progress on our targets below.
We openly disclose our performance and progress to our key stakeholders on ESG indicators. Every year, we publish our integrated annual report on sustainability progress in line with the UN Global Compact principles for responsible businesses. And we submit information about our sustainability and ESG performance to customers and investors via global ESG ranking platforms such as the CDP, EcoVadis, MSCI and Sustainalytics. Learn more about our rankings under Reporting and rankings.
Product data table
| |
2021/22 |
2020/21 |
2019/20 |
|
Revenue contribution to the UN SDGs
Gross revenue contribution, %
|
80 |
82
|
81 |
|
Better farming
Farmland treated with natural solutions, ha.
Accumulated ha. (base year 2015/16)
|
5.2m
23.2m |
4.4m
18m
|
3.2m
13.6m
|
|
Good health
People consuming Chr. Hansen probiotics, no.
|
195m
|
149m
|
163m
|
|
Food waste1
Yogurt waste reduction, tons2
Accumulated tons (base year 2015/16)
|
160,000
1,030,000 |
160,000
870,000 |
160,000
710,000 |
1 With Chr. Hansen’s Science Based Targets, the method for scope.
2 Upstream transportation was updated. The update entails a general improvement in data quality and the use of DEFRA emission factors including radiative forcing for air transport. Historical data for 2019/20 and 2020/21 is updated consequently.
Planet data table
| |
2021/22 |
2020/21 |
2019/20 |
|
Energy
Renewable energy (electricity), %3
Total energy consumption, MWh3
|
61
224,319
|
60
181,327
|
41
176,539
|
|
Company carbon footprint
Total Scope 1 CO₂e emitted, tons3
Total Scope 2 CO₂e emitted, tons (location-based)3
Total Scope 2 CO₂e emitted, tons (market-based)3
Total Scope 3 upstream transportation CO₂e emitted, tons4
|
24,231
24,305
17,897
54,554 |
16,303
20,246
15,963
50,505
|
17,073
23,224
30,382
56,168
|
|
Water
Total water consumption, m³ 3
|
1,329,712
|
1,233,281
|
1,142,435
|
|
Waste
Recycled biomass, tons3
Circular management of biomass, %3
Recycled solid waste, %3
Solid waste, tons3
Hazardous waste, % of solid waste3
Wastewater, m³ 3
|
145,603
91
54
4,900
2
914,058 |
96,193
70
60
3,764
2
955,601 |
99,737
71
49
3,694
3
865,430 |
|
Packaging
Recyclable key packaging material, %
|
66
|
68
|
67
|
|
Environmental Violations
Environmental violations, no.
|
0
|
2
|
0
|
3 This number is restated as a new data collection system was implemented during this financial year, improving data quality. Also, acquisitions are included with historical data.
4 With Chr. Hansen’s Science Based Targets, the method for scope.
People data table
| |
2021/22 |
2020/21 |
2019/20 |
|
People
Total number of employees
Average number of employees (full-time equivalents)
Employee turnover, %
|
3,834
3,693
16 |
3,702
3,396
14 |
3,286
2,901
10 |
|
Diversity and inclusion
Gender - all employees (male/female)5, %
Gender - managers (male/female)5, %
Gender - ratio between female employees and managers5
Gender - key positions (male/female), %
Board of Directors - (male/female/non-local), %
Retention of employees over the age of 30, %
Gender pay gap, %
|
56/44
62/38
44:38
69/31
50/50/67
81
4.1 |
57/43
63/37
43:37
68/32
50/50/63
83
6.2 |
57/43
63/37
43:37
73/27
71/29/57
|
|
Employee engagement
Engagement matters ranking, top %
New employees introduced to culture model, %
|
25
100 |
10
N/A6 |
34
100 |
|
Occupational health and safety
Lost Time Incidents (LTIs)
Frequency of LTIs per million working hours (LTIF)
Severity (days away per LTI)
Fatalities
|
11
1.7
8
0 |
6
1.0
2
0 |
7
1.3
8
0 |
5 2019/20 numbers have been adjusted to more accurately reflect the carve-out of Natural Colors.
6 COVID-19 has affected the onboarding process, making it more online-based. As a result, we are not able to report on this
indicator for 2020/21.